




Database Optimisation

Rental Marketplace Database Optimisation

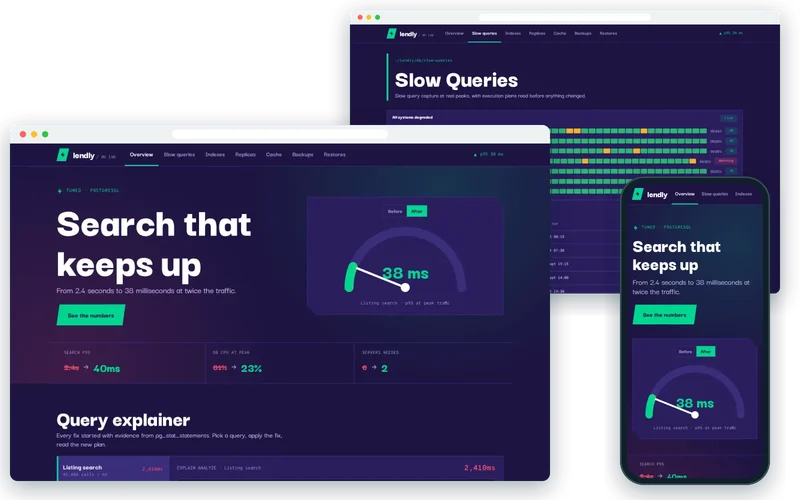
Search dropped from 2.4 seconds to 38 milliseconds, and the marketplace went from six database servers to two.

View live demo Opens a working demo with sample content in a new tab.
Lendly Marketplace demo on desktop and phone

On location

  • Camera Macbook — Lendly Marketplace
    Camera MacbookPhoto: Jessica Lewis (CC0)
  • Photography Gear — Lendly Marketplace
    Photography GearPhoto: Jeff Hopper (CC0)
  • Photographer Picture — Lendly Marketplace
    Photographer PicturePhoto: Matt Moloney (CC0)
  • Business Journal — Lendly Marketplace
    Business JournalPhoto: Karol Dach (CC0)
  • Camera Coffee — Lendly Marketplace
    Camera CoffeePhoto: Jessica Lewis (CC0)

About the Project

This project is a database optimisation for a peer-to-peer rental marketplace where people lend cameras, tools and equipment to each other. At peak times search and availability checks slowed to several seconds, owner dashboards took five seconds to load and the nightly payout job had grown to 38 minutes, overlapping with morning traffic. The response had been to keep adding database servers — six of them, with the bill to match.

Instead of adding hardware, we found out exactly where the time was going. With PostgreSQL performance tuning grounded in real peak-time evidence, search p95 improved from 2,410ms to 38ms, peak database CPU fell from 81% to 23%, the six database servers were reduced to two, and the payout run shortened from 38 minutes to four.

About the Client

The client runs a marketplace where owners list items for rent and renters search by category, location and dates. Search and availability are the heart of the product: if results are slow, renters leave before they ever see a listing.

The business had grown quickly, and the database had grown with it to around 1.2 million listings. The engineering team suspected the queries rather than the hardware but needed evidence and a clear plan before changing anything in production.

Project Goals

  • Make search and availability checks fast at peak traffic.
  • Reduce database CPU so the platform has headroom for growth.
  • Cut the number of database servers and the infrastructure bill.
  • Speed up owner dashboards and the nightly payout job.
  • Stop performance regressions from creeping back in.

Project Overview

The Challenge and Our Solution

The Challenge

Search and availability checks slowed to several seconds at peak, and the response had been to add database servers — six of them, with the bill to match. Owner dashboards took five seconds to load, and the nightly payout job had grown to 38 minutes, overlapping with morning traffic.

Our Solution

We captured slow query logs during real peaks rather than guessing, and read the execution plans. Search was doing a sequential scan over 1.2 million listings because the filter combination had no supporting index; availability checks were querying a date range per listing in a loop. We added covering indexes, rewrote the owner dashboard queries to aggregate in one pass, moved read-heavy traffic to replicas, put a Redis cache in front of the hottest lookups, and batched the payout job.

Evidence Before Changes

We captured slow query logs during real peaks using pg_stat_statements rather than guessing, and ranked queries by total time consumed — the product of how slow each one is and how often it runs. That ranking showed that a handful of queries were responsible for most of the load.

For each, we read the execution plan with EXPLAIN ANALYZE to see what PostgreSQL was actually doing, which turned vague complaints about slowness into specific, fixable problems.

  • Peak-time evidence from pg_stat_statements
  • Queries ranked by total time, not just slowest
  • Execution plans read for every top offender

Indexes That Match the Queries

Listing search was doing a sequential scan over 1.2 million listings because the combination of filters it used had no supporting index. A composite index matching those filters and the sort order let PostgreSQL go straight to the right rows, taking search p95 from 2,410ms to 38ms.

Availability checks were querying a date range per listing in a loop. Restructuring them and adding an index suited to range lookups turned hundreds of small queries into one efficient one.

  • Composite index for search filters and sort
  • Range-friendly indexing for availability
  • Loops of small queries replaced by single queries

Rewrites, Replicas and Caching

Owner dashboards ran many separate queries per listing. We rewrote them to aggregate in a single pass, bringing load times down sharply. The nightly payout job, which processed payouts one row at a time, was batched, shortening it from 38 minutes to four.

Read-heavy traffic moved to read replicas, connection pooling smoothed spikes, and a Redis cache sits in front of the hottest lookups. With the primary database no longer overloaded, six servers became two and peak CPU fell from 81% to 23%.

  • Dashboard queries aggregated in one pass
  • Batched payouts: 38 minutes down to four
  • Replicas, pooling and Redis for read-heavy traffic

Protection Against Regressions

Performance improvements fade if nobody watches them. Grafana dashboards now track query latency, CPU and cache hit rates, with alerts when key queries slow down.

CI performance checks run critical queries against a realistic dataset on every change, so a new feature that accidentally removes an index or adds an expensive query is caught before it reaches production rather than after users notice.

  • Dashboards and alerts for query latency
  • CI performance checks on realistic data
  • Regressions caught before release

Our Process

How We Delivered It

  1. Measure at Peak

    Slow query logs and statistics were captured during real peak traffic to find where time was spent.

  2. Read the Plans

    Execution plans for the top queries showed sequential scans, loops and missing indexes.

  3. Fix in Order of Impact

    Indexes, rewrites and batching were applied to the queries consuming the most total time first.

  4. Scale Reads Sensibly

    Read replicas, connection pooling and Redis caching were added where reads dominated.

  5. Guard the Gains

    Dashboards, alerts and CI performance checks keep the improvements in place.

Key Features

What We Delivered

  • Evidence-led investigation

    Slow query capture at real peaks, with execution plans read before anything changed.

  • Index & query rewrites

    Covering indexes and single-pass aggregates replacing loops and sequential scans.

  • Read replicas & caching

    Read traffic moved off the primary, with Redis in front of the hottest lookups.

  • Regression protection

    Query performance checks in CI so a slow query cannot quietly return.

Outcome

Results and Impact

  • Search p95 improved from 2,410ms to 38ms.
  • Peak database CPU fell from 81% to 23%.
  • Six database servers reduced to two, cutting infrastructure spend.
  • Nightly payout run shortened from 38 minutes to four.

Client Feedback

What the Client Says

★★★★★

We were about to buy a seventh database server. They profiled the actual queries instead and we went down to two. Search went from two and a half seconds to under fifty milliseconds at twice the traffic. That conversation paid for the engagement several times over.

CTOPeer-to-peer rental marketplace

Services

Services Behind This Project

The Node.js, Database expertise we used to build this database optimisation — and can bring to yours.

  • Node.js Development

    Node.js back-end development: Express and NestJS APIs, real-time services, background jobs, MySQL/MongoDB data layers and Redis caching.

  • Database Development

    Schema design, query and index tuning, migrations and search infrastructure across MySQL, PostgreSQL, MongoDB, Redis and Elasticsearch.

FAQ

Frequently Asked Questions

Should we add more database servers when queries get slow?

Usually not first. Extra servers hide the problem and multiply the bill, while the slow queries keep getting slower as data grows. Measuring which queries consume the most time and reading their execution plans often reveals missing indexes or inefficient patterns that can be fixed for a fraction of the cost.

What is pg_stat_statements and why use it?

pg_stat_statements is a PostgreSQL extension that records how often each query runs and how long it takes in total. It shows which queries actually consume the database’s time under real traffic, so optimisation effort goes where it has the biggest effect instead of where someone guesses the problem is.

Can adding indexes make things worse?

Yes, if done carelessly. Every index speeds up some reads but adds work to writes and uses storage. Good indexing matches the filters and sort orders your important queries really use, avoids duplicates and is created concurrently in production to avoid locking tables during busy periods.

When do read replicas and caching help?

Read replicas help when most traffic reads data that does not need to be up to the millisecond, such as search results and dashboards. Caching suits lookups that are requested constantly and change rarely. Both work best after queries are efficient; they are not a substitute for fixing slow SQL.

How do you optimise a production database safely?

Changes are tested on a copy with realistic data, indexes are built concurrently, and query rewrites are released behind feature flags or gradually. We monitor latency and errors during each change and keep a rollback path, so improvements land without downtime or surprises for users.

How do we stop performance from degrading again?

Put monitoring and alerts on key query latency, and add performance checks to the CI pipeline that run critical queries against realistic data. That way a change that removes an index or adds an expensive query is spotted during development, not by customers at peak time.

Similar Work

Related Projects

Case studies built with the same technologies or for similar needs.

  • Semi trucks line up to pick — Northline Freight
    • React
    • TypeScript
    • Node.js

    Web Application Development

    Freight Dispatch & Driver Tracking Platform

    A live dispatch board built in React and Node.js that replaced a spreadsheet-and-phone workflow for 120 drivers.

  • Bricks Wall — Barrow Building Supplies
    • Node.js
    • NestJS
    • TypeScript

    API & ERP Integration

    ERP to Web Shop Integration

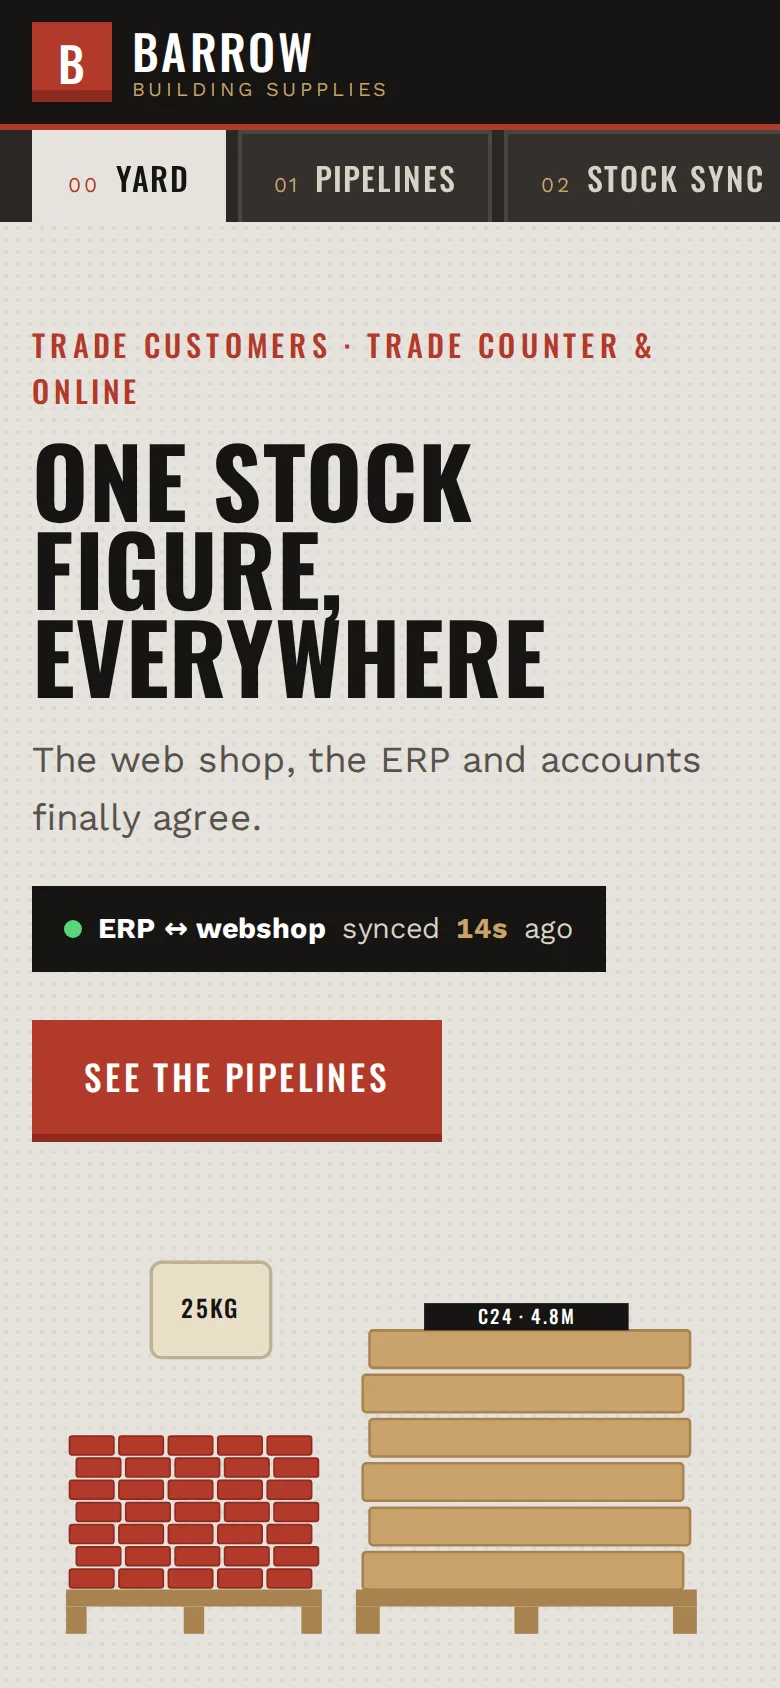
    A NestJS integration layer moving 312,000 messages a day between an ERP, a web shop and the accounts system.

  • Accounting Finance — Ledgerline Accountants
    • Python
    • FastAPI
    • Tesseract OCR

    Data Automation & OCR

    Invoice Processing & OCR Automation

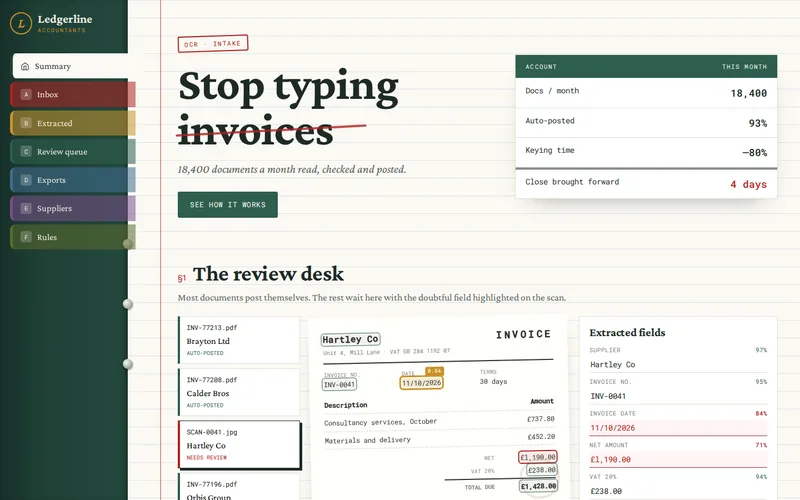
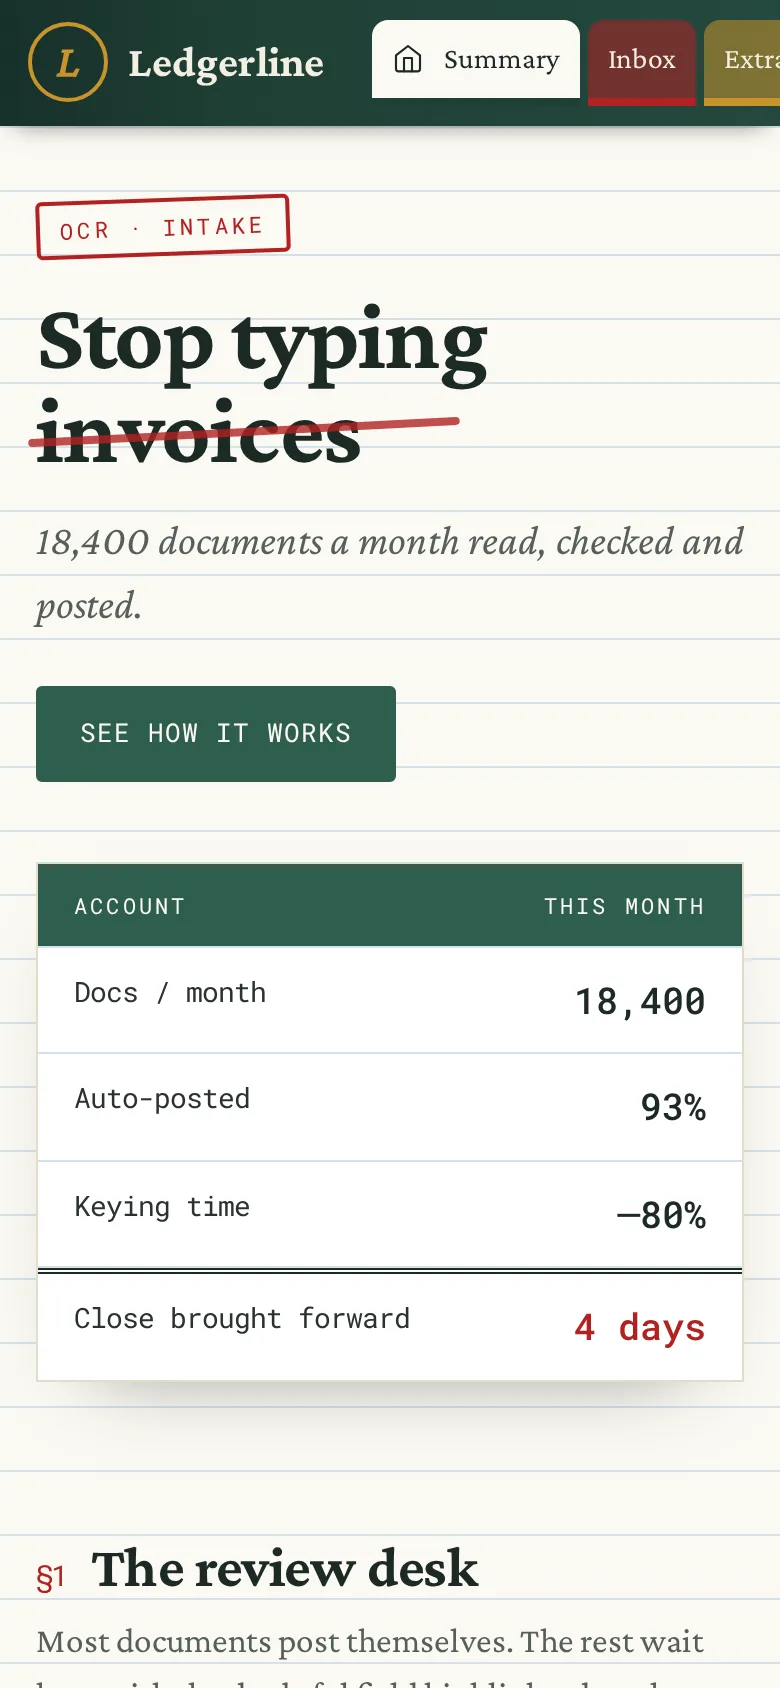
    A Python pipeline that reads 18,400 supplier documents a month and posts 93% of them without a person keying anything.

  • Tools Workshop — Quotely
    • Ruby on Rails
    • Hotwire (Turbo & Stimulus)
    • PostgreSQL

    SaaS Product Development

    Field-Service Quoting SaaS

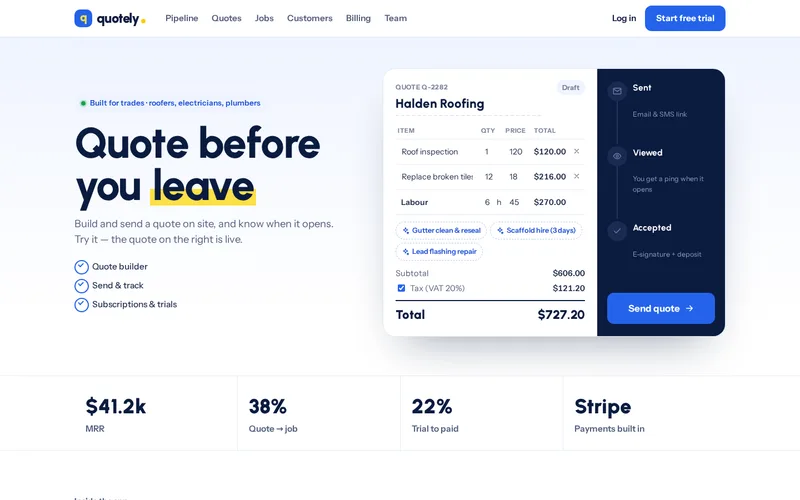
    A Rails MVP taken from idea to paying subscribers in ten weeks, with Stripe billing and Hotwire interactivity.

  • Antique Watch — Ridgemont Auctions
    • Elixir
    • Phoenix Channels
    • Go

    Real-Time Web Platform

    Live Auction Bidding Platform

    An Elixir and Go platform holding 11,000+ concurrent bidders per sale with bid latency measured in milliseconds.

  • Guy Man — Altura Tours
    • Vue 3
    • Nuxt
    • TypeScript

    Booking Platform Development

    Adventure Tour Booking & Itinerary Platform

    A Vue 3 and Nuxt platform handling departures, seat availability, deposits and guide assignments for multi-day tours.

Let’s Connect

Want Results Like These?

Share your project details and our experts will get back to you within one business day with the best solution — free consultation, no obligation.